Campaign reports help you track the performance of your campaigns. You can use data from your reports to monitor campaign performance and learn how audiences interact with your campaign emails.
View Reports
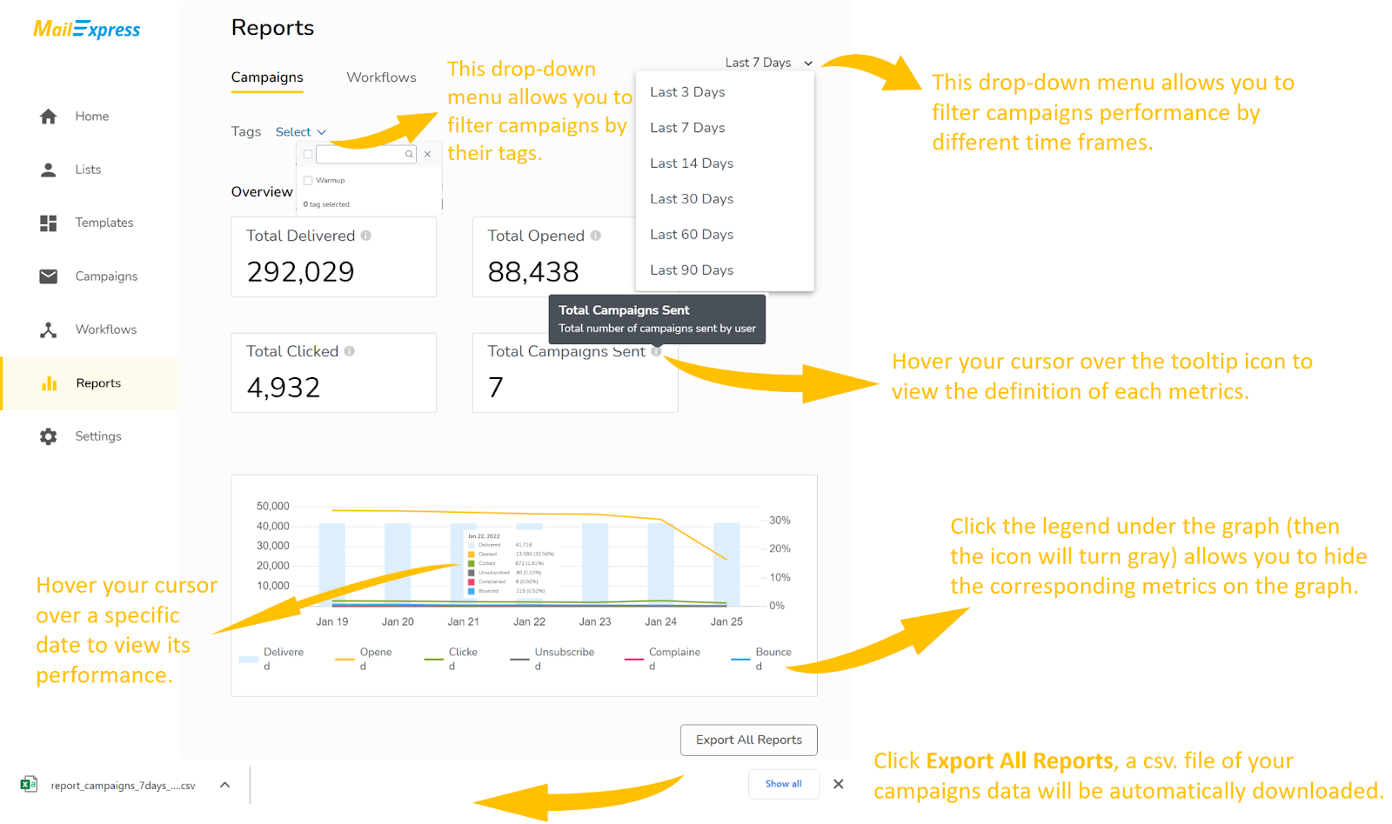
In the left Navigation menu, go to the Reports tab. The Reports tab displays an aggregate statistic for a group of campaign emails filtered by their Tags.
Let’s first take a quick look at the Reports tab, then dive into it.
Report Overview
Here's an overview of what you'll find in your report.
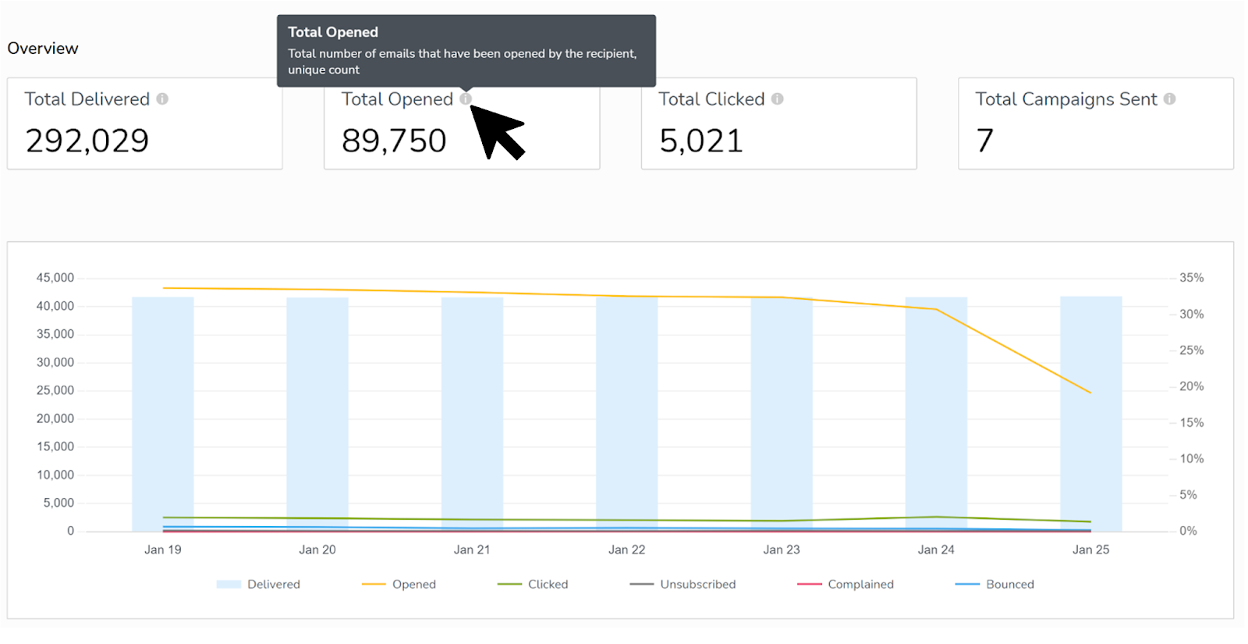
Hover your cursor over the tooltip icon to see the definition of each metric.
- Total Delivered
Total number of emails that have been sent and arrived in the recipients' inbox
- Total Opened
Total number of emails that the recipients have opened, unique count
- Total Clicked
Total number of times recipients clicked a link in the email body, unique count
- Total Campaigns Sent
Total number of campaigns sent by user
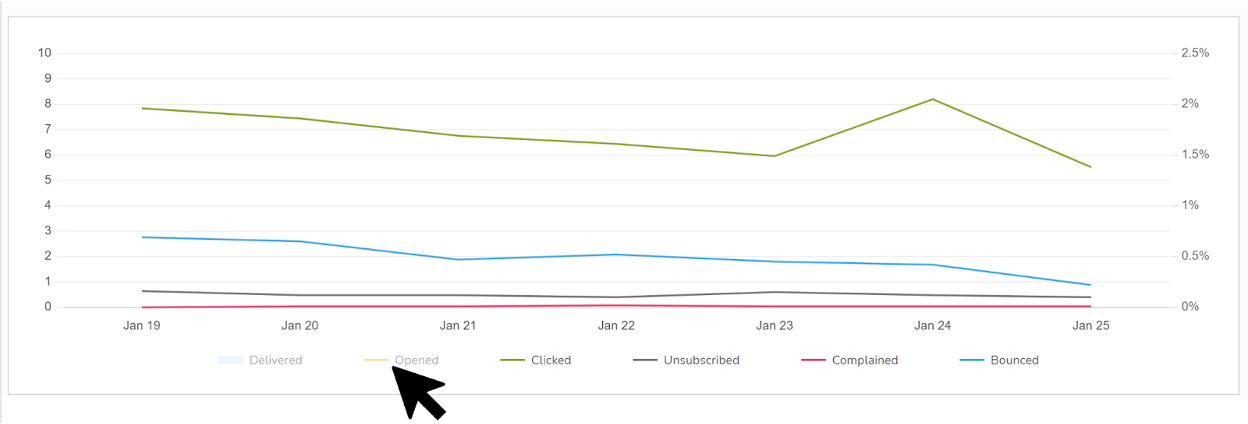
Hover your cursor over the bar to view the number delivered, opened, clicked, unsubscribed, complained, and bounced that day. All these metrics give you insights into how people reacted to and engaged with your emails.
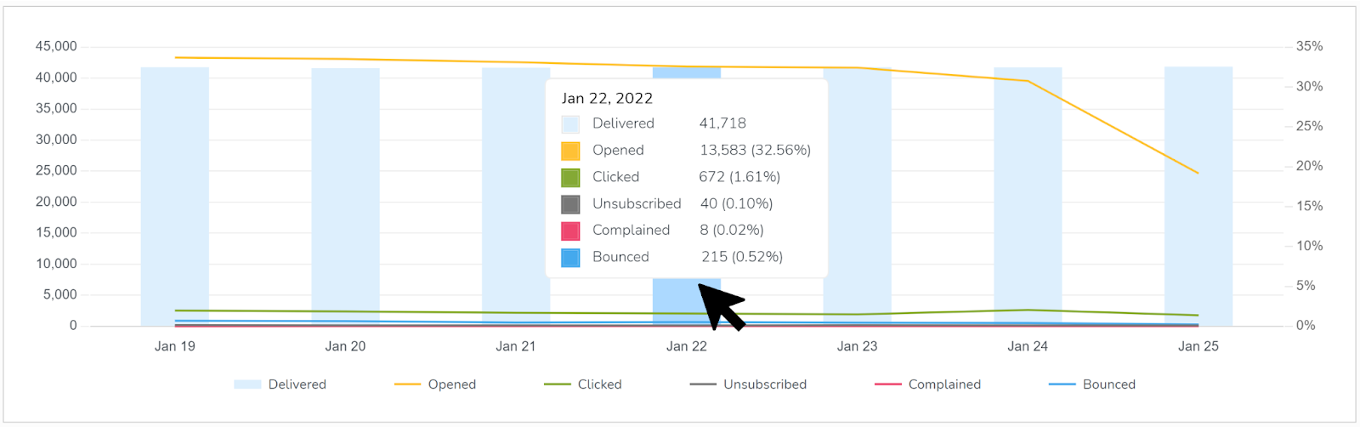
Delivered = Sent - Bounced
Opened rate = Unique opens / Delivered x 100%
Click rate = Unique clicks / Delivered x 100%
Unsubscribed rate = Unsubscribed / Delivered x 100%
Complained rate = Complained / Delivered x 100%
Bounced rate = Bounced / Delivered x 100%
Unclick the legend (make it gray) to hide the corresponding metrics on the graph
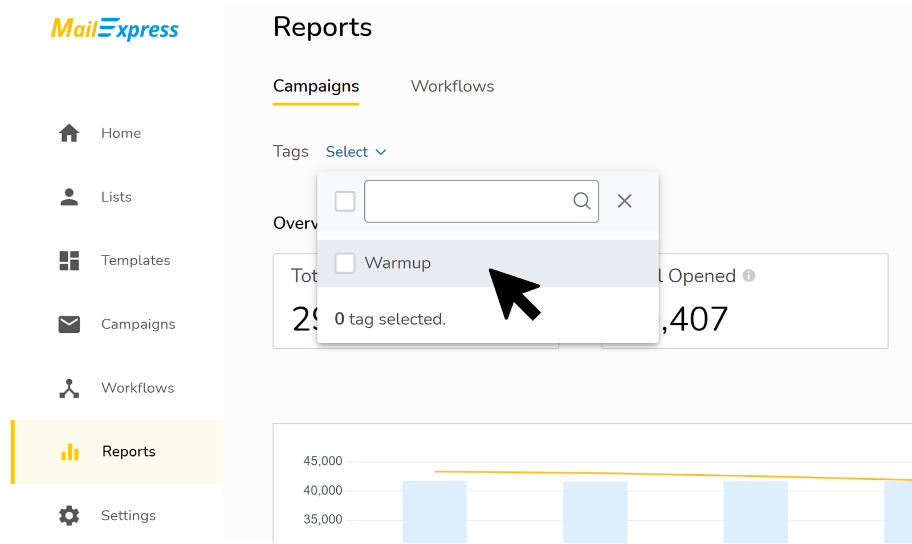
View the aggregate reports of selected campaigns
You can always filter your campaigns and view an aggregated report of a group of campaigns by selecting their tags in the drop-down menu next to Tags -> Select.
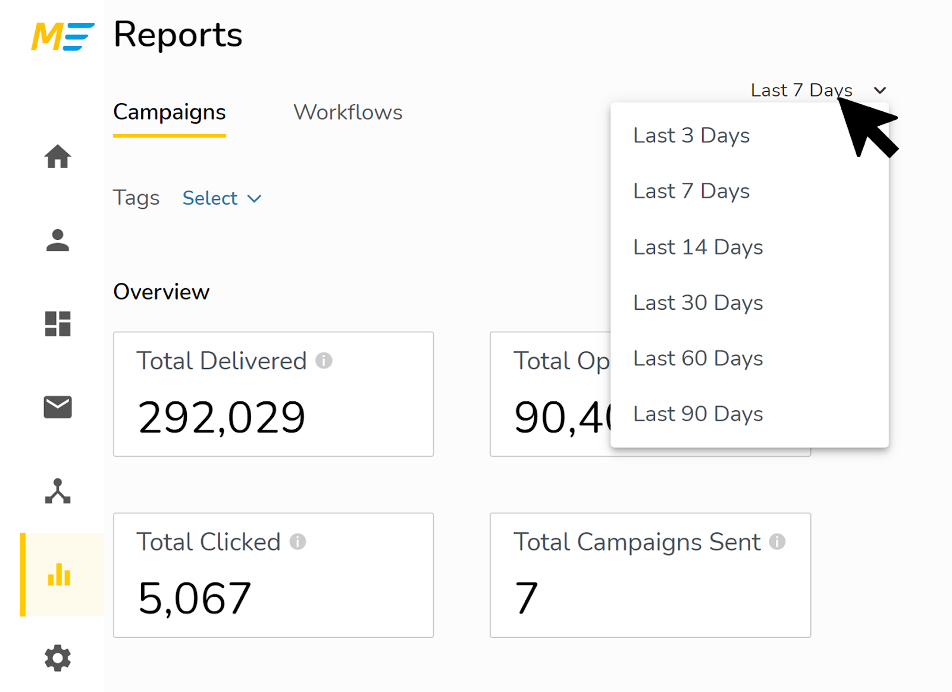
Filter a report based on the campaigns‘ time frame
You can view an aggregate campaign report of the last 3 days, 7 days, 14 days, 30 days, 60 days, or 90 days using the time-based filter at the top-right corner. This filter will be applied to the whole Reports page.
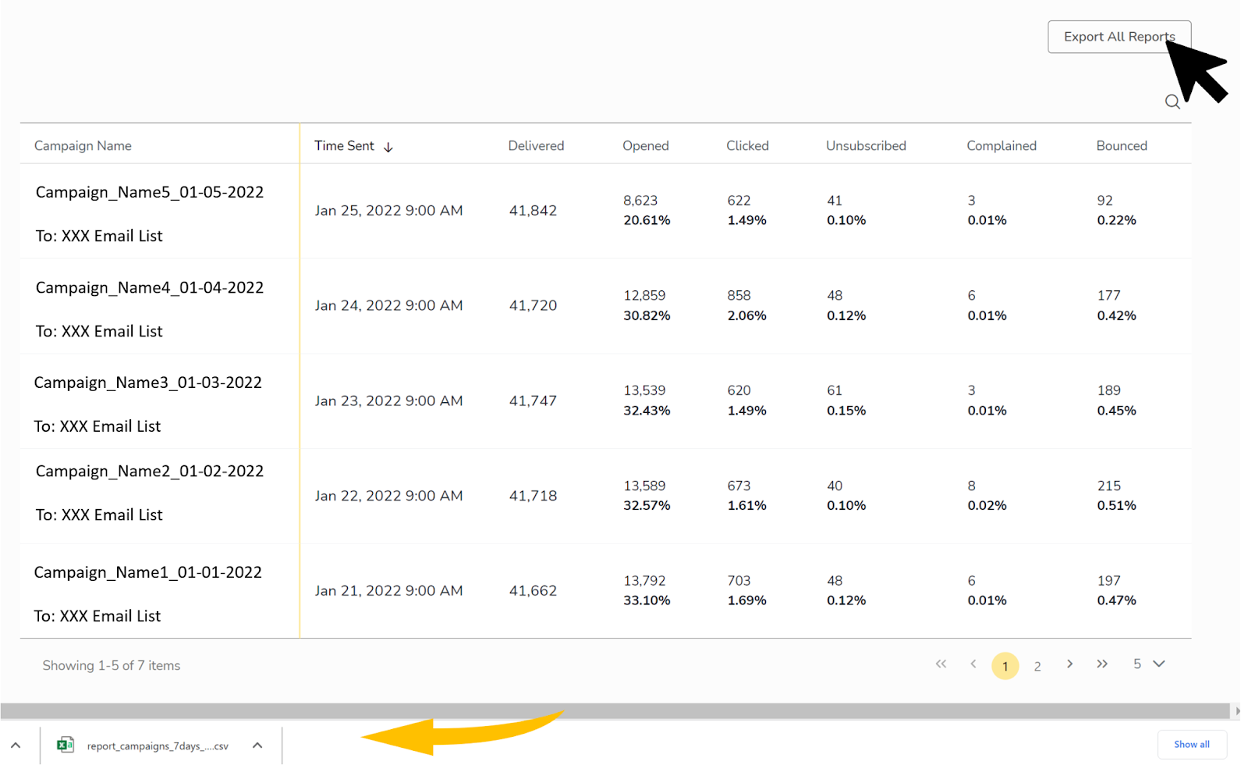
Export/Download Reports
Click on the Export All Reports button to download the campaign report in a .csv file. You can also preview the report in the table below.